

Executive Summary
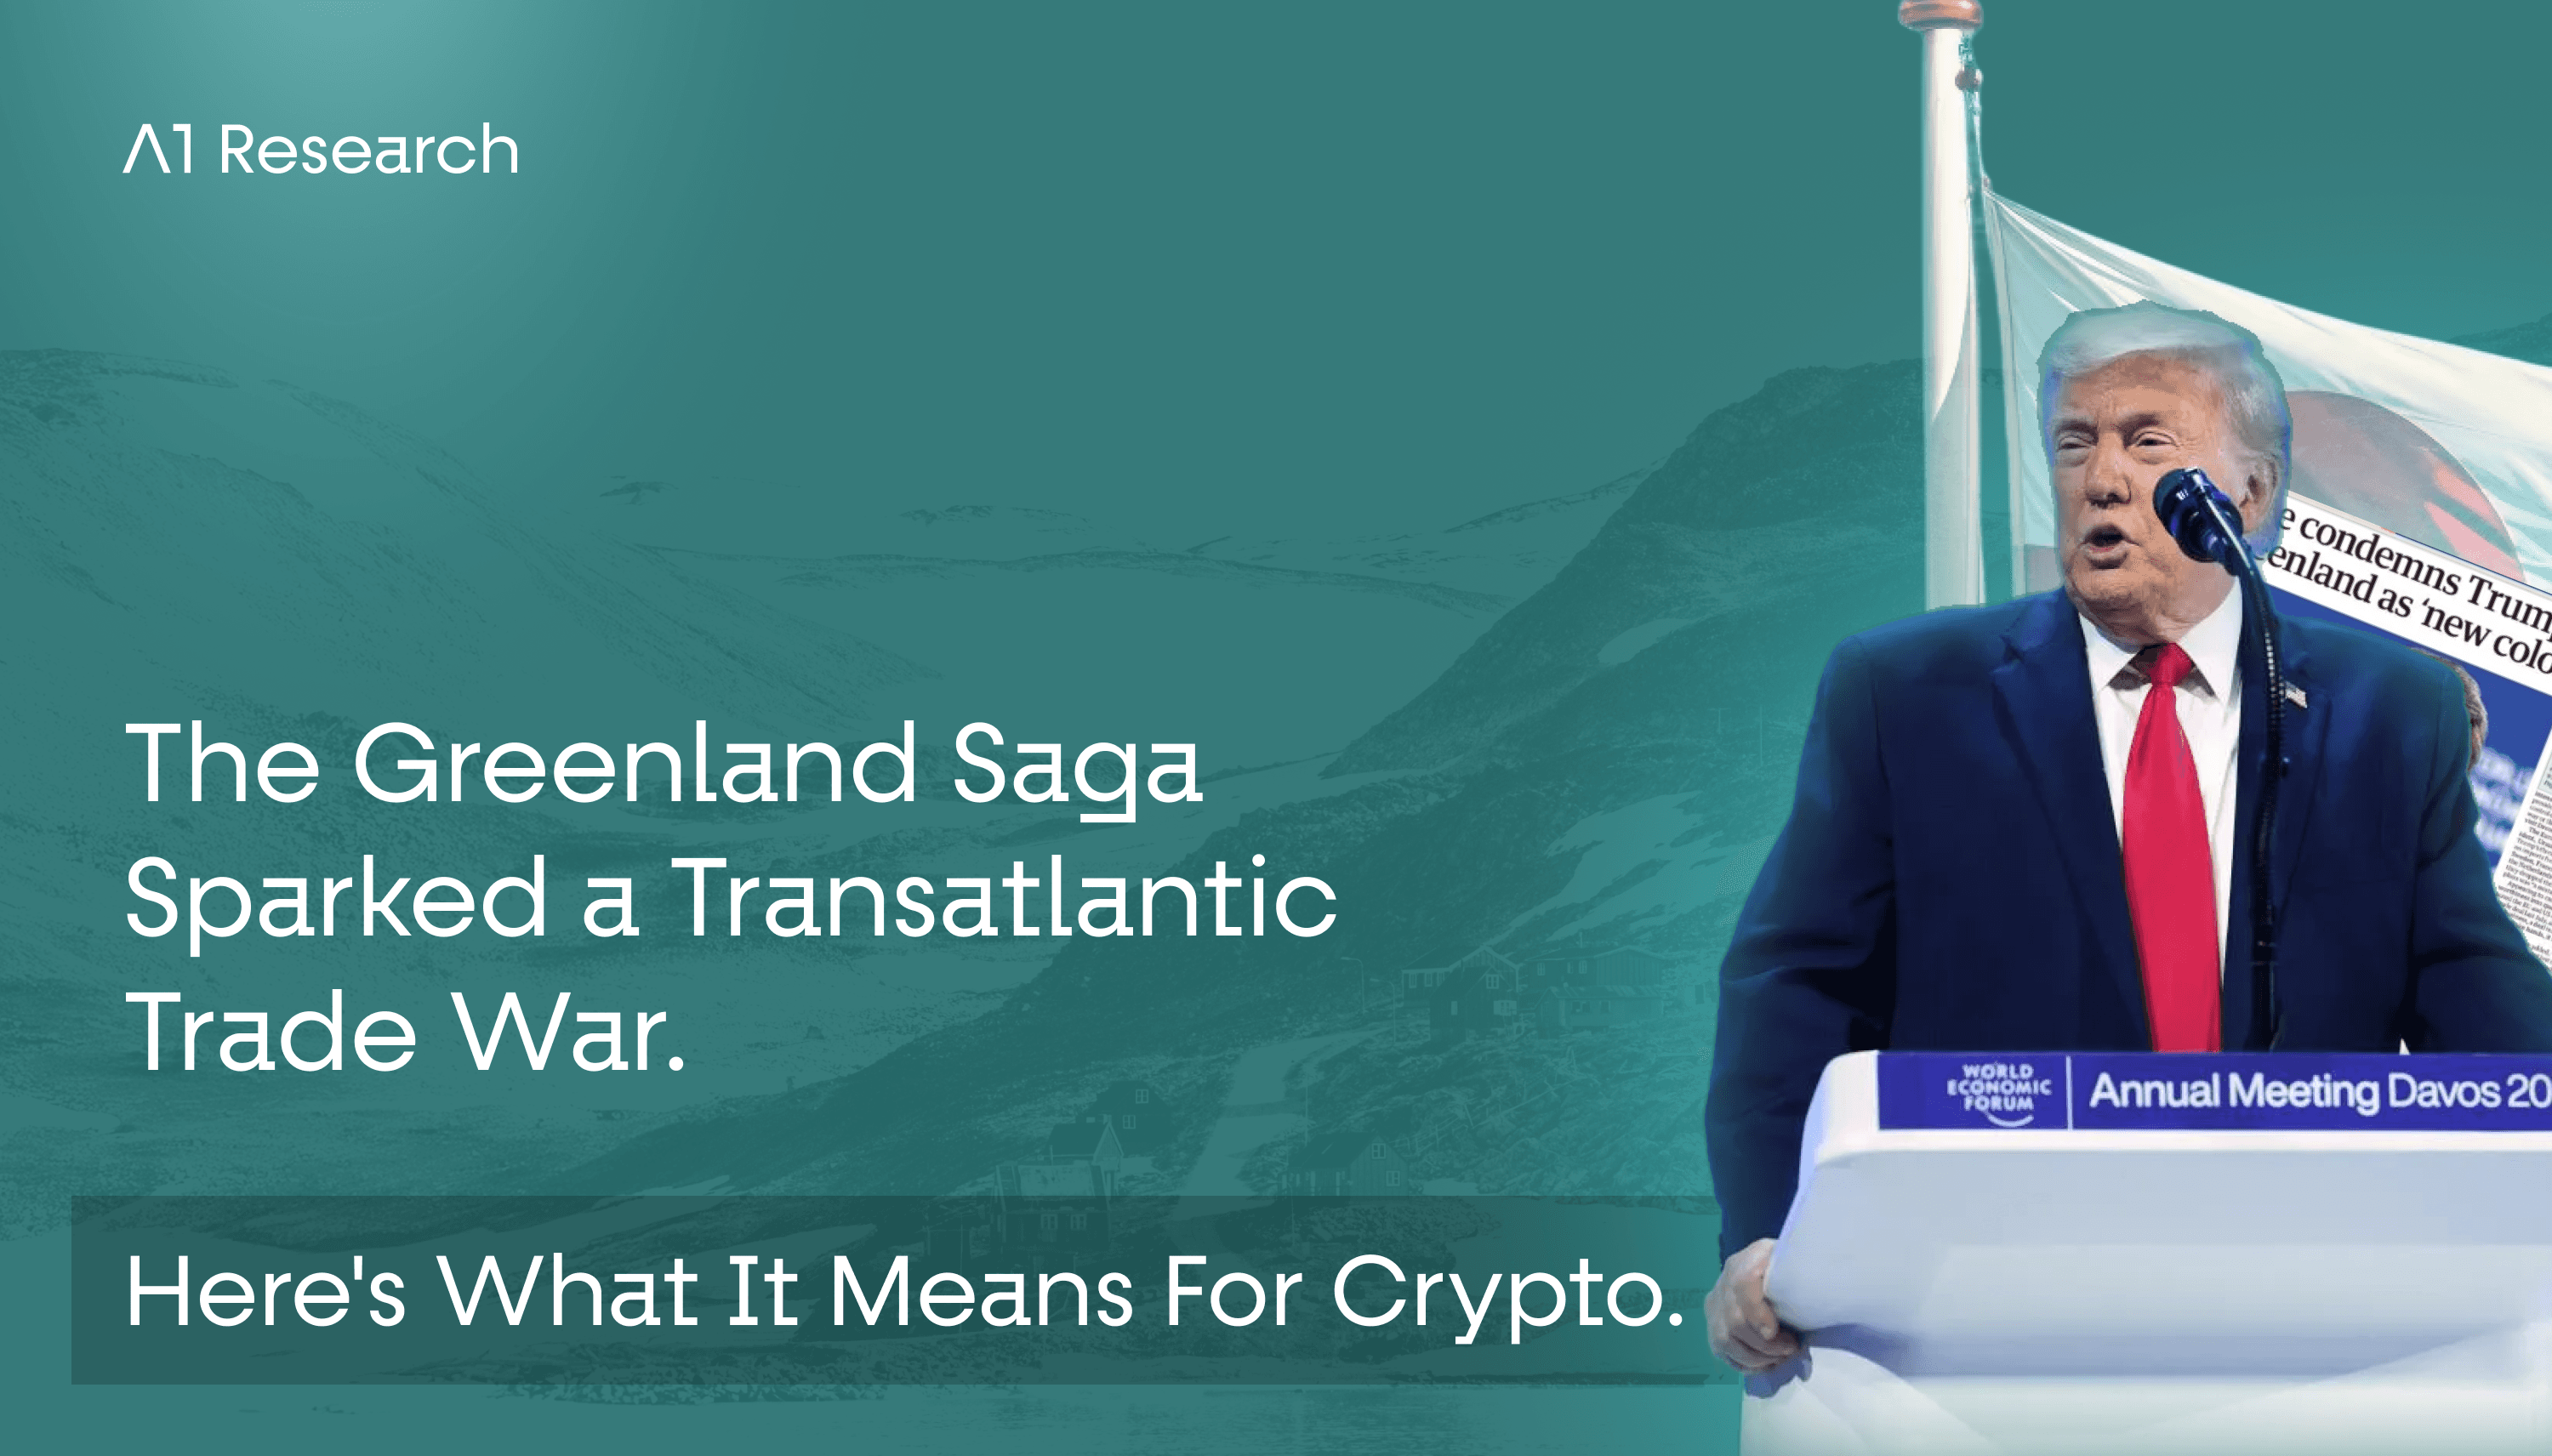
On January 17, 2026, the Trump administration announced 10% tariffs on eight European nations, effective February 1, escalating to 25% by June 1 unless Denmark agrees to sell Greenland.
Four days later, at the World Economic Forum in Davos, President Trump announced a "framework of a future deal" with NATO Secretary General Mark Rutte, effectively cancelling the threatened tariffs.
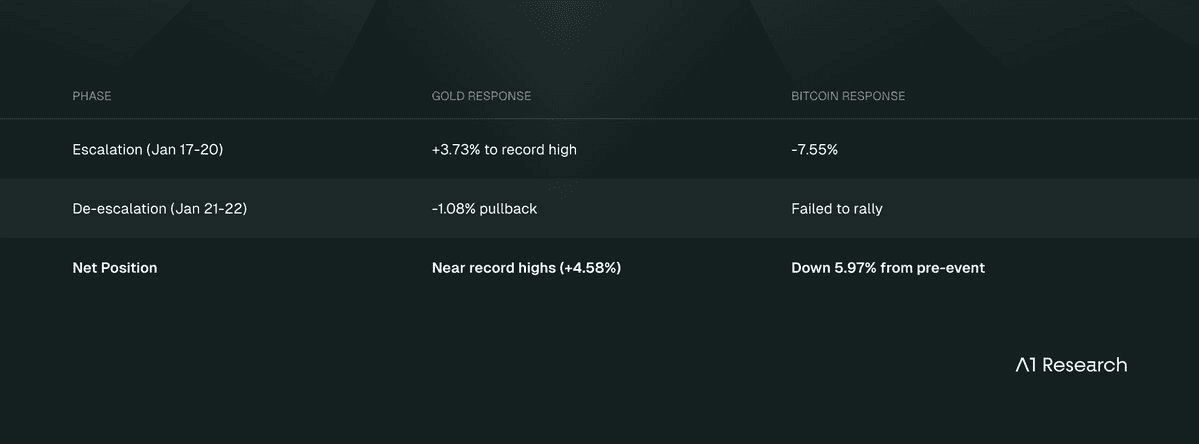
Through the event's full cycle, escalation and de-escalation, Bitcoin fell 5.97% while gold rallied 4.58%. The divergence persisted even after resolution.
That 10.55 percentage point gap is the starting point for this analysis. Not because the divergence is unusual, but because it is completely predictable. Bitcoin has underperformed gold in seven of the last eight major policy uncertainty events. The "digital gold" narrative does not survive contact with the data.
This matters for positioning. If you expect Bitcoin to behave like gold during uncertainty, you will be consistently wrong.
But if you understand what Bitcoin actually is, a different picture emerges: the same conditions creating short-term weakness may be setting up medium-term opportunity.
The de-escalation event provides additional confirmation. Bitcoin failed to recover alongside equities when tariffs were cancelled, while gold retained most of its gains.
Flowing from this, our analysis makes three claims:
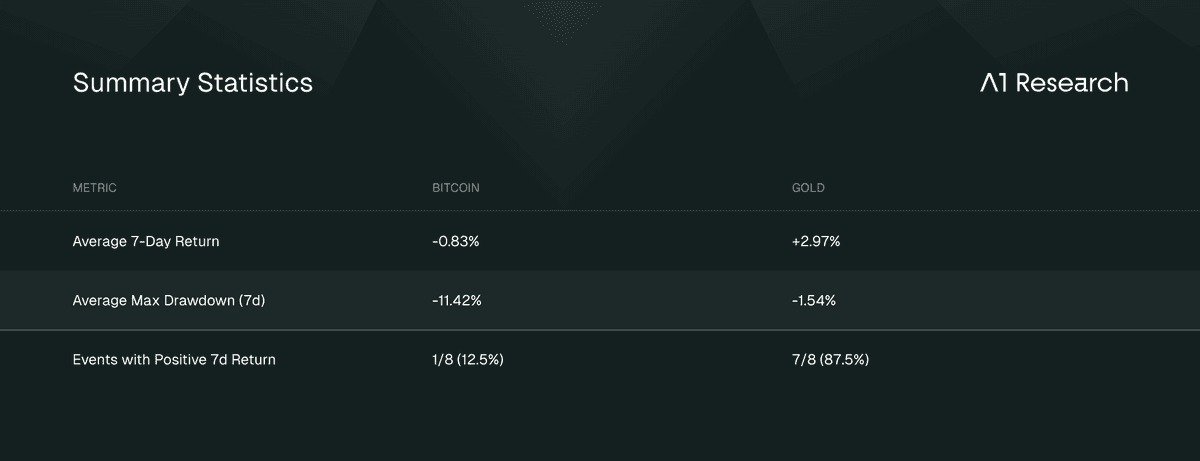
Bitcoin is a risk asset, not a safe haven. The historical record is unambiguous: 1 of 8 positive 7-day returns during policy shocks versus gold's 7 of 8. The de-escalation response, where Bitcoin failed to rally while equities recovered, provides additional confirmation.
Tariff escalation creates a measurable path to fiscal deterioration. The 2018-2019 China tariffs generated roughly $80 billion in revenue, but 92% was offset by farmer bailouts. CBO dynamic scoring shows current tariffs add approximately $300 billion to deficits through GDP effects.
The risk-reward math currently favors patience. On-chain support at $80,000-$85,000 provides institutional anchoring. Under reasonable probability assumptions, the 12-month expected value is positive.
The rest of this report provides the evidence for our claims.
Part I: The Event
What Was Announced
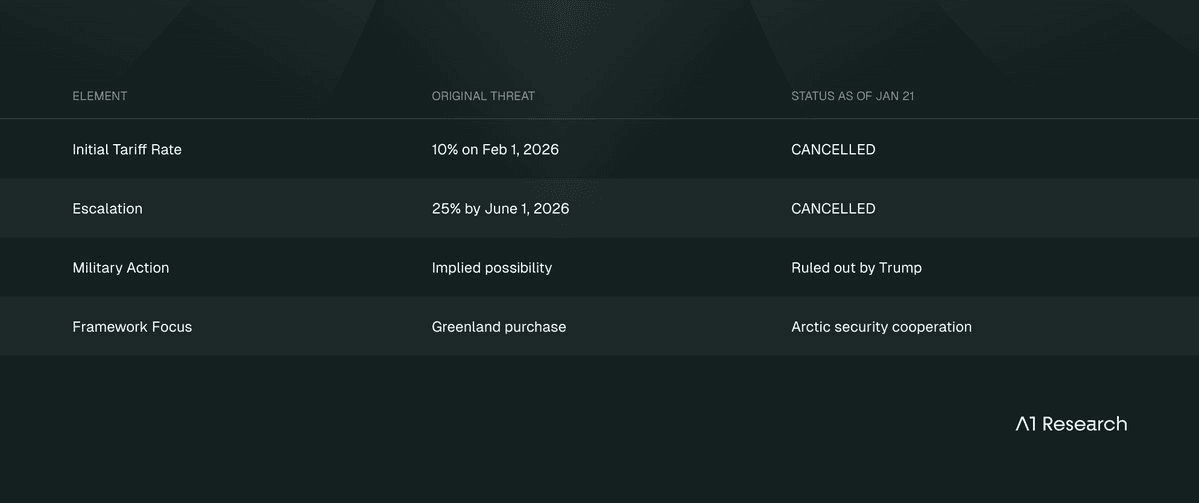
The January 17 announcement included specific terms:
Initial Rate: 10% tariffs effective February 1, 2026
Escalation: 25% by June 1, 2026 absent a deal
Stated Condition: "Complete and Total purchase of Greenland"
Countries Targeted: Denmark, Norway, Sweden, France, Germany, United Kingdom, Netherlands, Finland
What Was Subsequently Cancelled (January 21, 2026)
At the World Economic Forum in Davos, President Trump announced a "framework of a future deal" with NATO Secretary General Mark Rutte.
Trump characterized the agreement as focusing on "Arctic security and preventing Russian and Chinese foothold in Greenland."
Specifics remain vague, but the immediate tariff threat has been removed.
Why Markets Reacted
Economists classify this type of action as a credibility shock. Unlike routine policy adjustments, credibility shocks force market participants to rapidly reassess assumptions about institutional behavior.
Research by Alfaro, Bloom, and Lin (Journal of Political Economy, 2024) shows that financial frictions double both the impact and duration of uncertainty shocks. An uncertainty shock with financial frictions produces a peak output drop of 3.9%, compared to 1.8% without.
During financial stress like 2008-2009, the multiplier increases to roughly threefold.
Baker, Bloom, and Davis's Economic Policy Uncertainty Index (Quarterly Journal of Economics, 2016) registered unprecedented readings during similar tariff events. In mid-April 2025, the EPU reached 8.3 standard deviations above the historical mean, with trade policy uncertainty at 16+ standard deviations.
This explains why cryptocurrency markets, with their 24/7 trading and embedded leverage, show amplified responses.
The $864-866 million in liquidations within 24 hours, with 90% from long positions, reflects this amplification at work. Total ETF outflows during the event reached approximately $480 million.
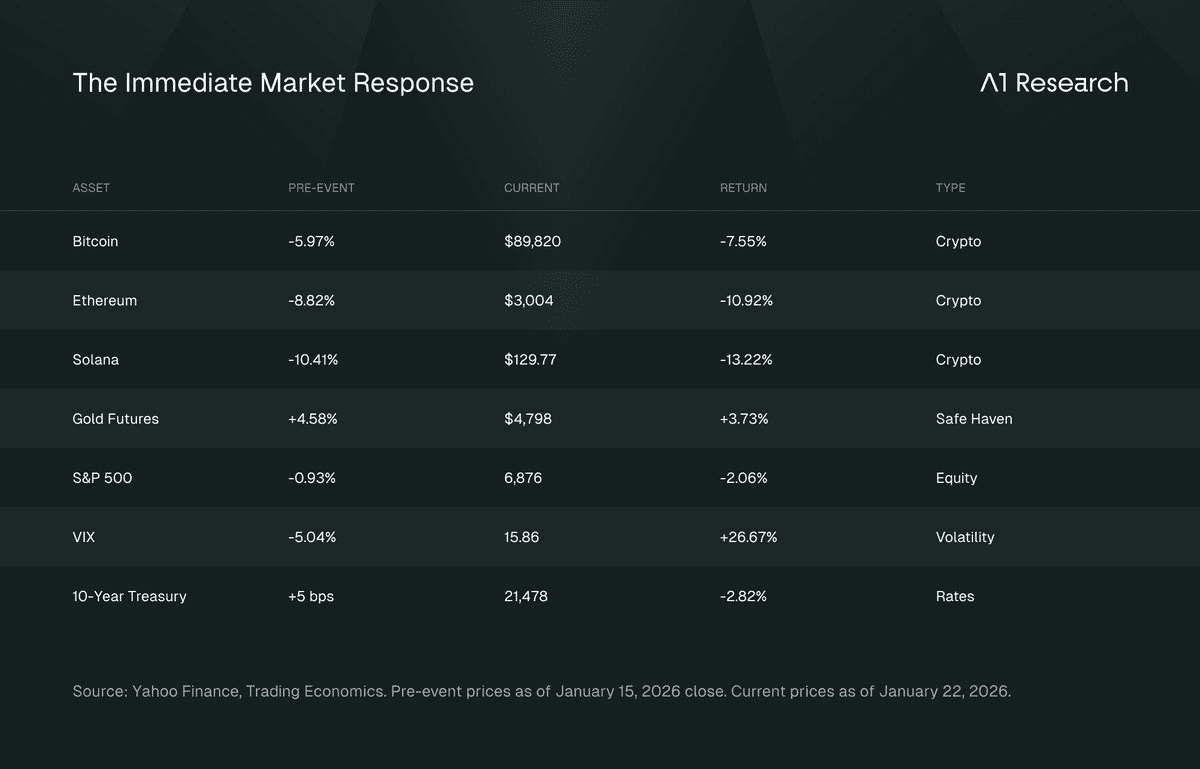
The pattern is clear: Every cryptocurrency fell. Gold rallied. Equities declined modestly then recovered. Volatility spiked then normalized. This is textbook risk-off behavior during escalation, followed by risk-on recovery during de-escalation. Except for Bitcoin, which failed to participate in the recovery.
Bitcoin failed to recover alongside equities when tariffs were cancelled, while gold retained most of its gains. This asymmetric response to de-escalation provides additional confirmation of the risk-asset thesis.
The question is whether this pattern is an aberration or a feature. The historical record answers that question definitively.
Part II: The Digital Gold Myth
The Claim
Proponents argue Bitcoin should function as "digital gold," a store of value that appreciates during uncertainty as investors seek safety outside the traditional financial system.
The Evidence
Across eight major policy uncertainty events from 2015 to 2026, Bitcoin posted positive 7-day returns in exactly one case. Gold posted positive returns in seven of eight.
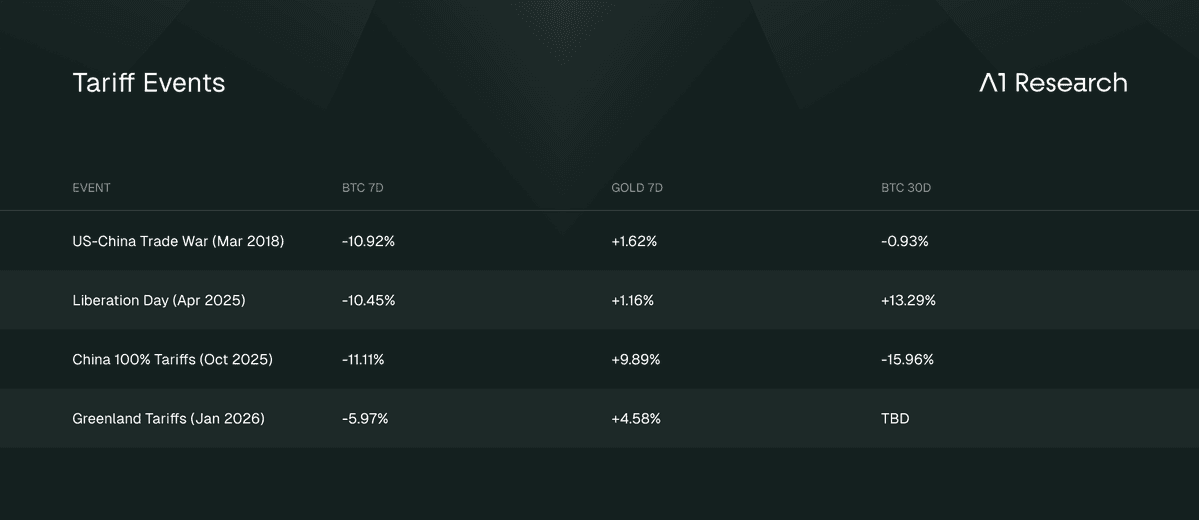
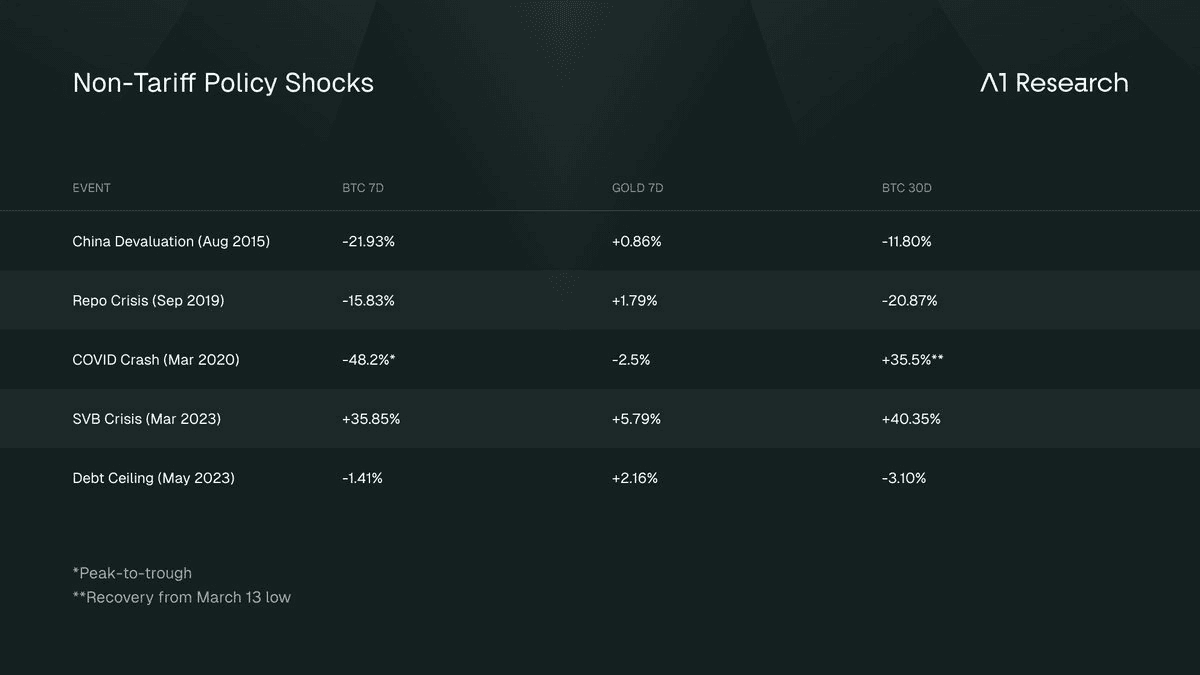
This is not a close call. Bitcoin trades like a risk asset during policy uncertainty.
The narrative does not match the data.
The De-Escalation Test
The January 21 Davos framework provides a second data point within the same event. A natural experiment testing whether Bitcoin would recover when uncertainty resolved.
Key observation: Gold rallied during uncertainty AND held gains during de-escalation. Bitcoin fell during uncertainty AND failed to recover during de-escalation. This asymmetric response reinforces our thesis: Bitcoin is NOT digital gold during policy uncertainty events.
The de-escalation test is arguably more damning than the initial reaction. If Bitcoin were truly "digital gold," we would expect:
Rally during uncertainty (like gold): FAILED
OR recovery when uncertainty resolves (like equities): ALSO FAILED
Bitcoin exhibited neither safe-haven behavior nor standard risk-asset recovery. It captured the downside of uncertainty without the upside of resolution.
Two Exceptions That Prove the Rule
SVB Crisis (March 2023): Bitcoin rallied 35.85% over seven days while the banking system faced a confidence crisis. This is the ONLY instance of Bitcoin outperforming during a policy shock.
The distinction matters: SVB represented a direct threat to traditional banking infrastructure. Bitcoin's rally reflected its utility as an escape route from banks, not as a general safe haven.
COVID Crash (March 2020): Bitcoin fell 37.2% in a single day, then recovered 35.5% within 24 hours of hitting bottom. But note: gold also fell 4.6% on March 12. When liquidity evaporates, everything sells.
The exception tells us that after extreme liquidation events exhaust selling pressure, Bitcoin can recover quickly.
What This Means
Bitcoin may show resilience under TWO narrow conditions:
When the crisis directly threatens traditional financial system integrity
After extreme liquidation events exhaust selling pressure
Trade policy disputes meet neither criterion.
This explains the consistent underperformance during tariff announcements.
The de-escalation response provides the clearest evidence yet: Bitcoin's "digital gold" narrative fails not just during uncertainty escalation, but also during de-escalation. The thesis is confirmed in BOTH directions.
But here is where the analysis gets more interesting.
The same forces causing short-term pain, fiscal uncertainty and policy instability, are the forces that could strengthen the longer-term case for monetary alternatives.
To understand why, we need to trace how tariffs actually affect the fiscal picture.
Part III: Following the Money
The Starting Point: Where We Are Now
Before examining tariff impacts, the baseline matters.
The US fiscal position is already stretched:
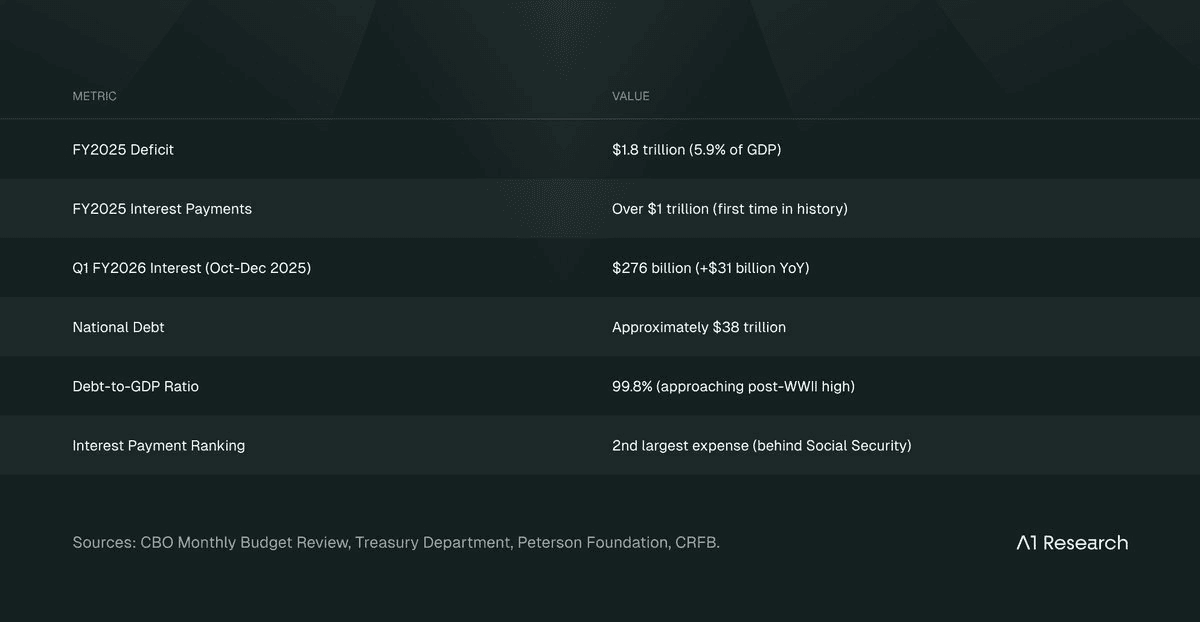
Interest payments now exceed defense spending. This is the backdrop against which tariff policy operates.
Tariff Revenue: The Headlines
CBO's static projections (November 2025) show:
Gross revenue: $2.5 trillion over 2025-2035
Interest savings: Additional $0.5 trillion
Total headline deficit reduction: $3.0 trillion
These are the numbers that make tariff policy look fiscally responsible.
Note: The January 21 cancellation of Greenland-specific tariffs removes one layer of planned tariff escalation. However, the underlying tariff structure (China 100%, existing EU tariffs) remains in place, and these projections primarily reflect that baseline.
Tariff Revenue: The Reality
CBO's dynamic scoring tells a different story:
GDP impact: -0.6% real GDP by 2035
Economic effects add approximately $300 billion to deficits
Net dynamic deficit reduction: $2.8 trillion (not $3.0 trillion)
And that assumes the revenue is actually retained. The 2018-2019 China tariffs show what happens in practice:
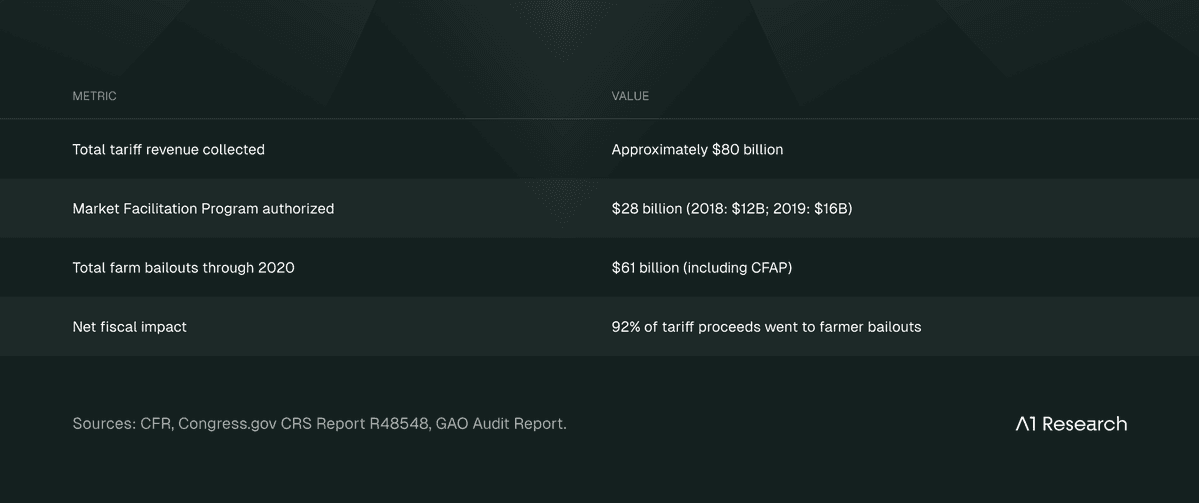
The GAO's 2021 finding: USDA's methodology "used baselines that did not best represent what trade would be absent the retaliatory tariffs." Trade damage was inflated to justify larger bailouts.
The pattern is repeating.
Farm bankruptcies in Q2 2025 doubled the entire 2024 total. Soybean exports to China are effectively zero. A $10-14 billion farmer bailout is under consideration.
The Causal Chain
Step 1: Tariffs generate headline revenue ($195 billion collected in FY2025, up 250% YoY).
Step 2: Retaliatory measures damage export sectors.
Step 3: Bailouts offset most of the revenue gain (historical rate: 92%).
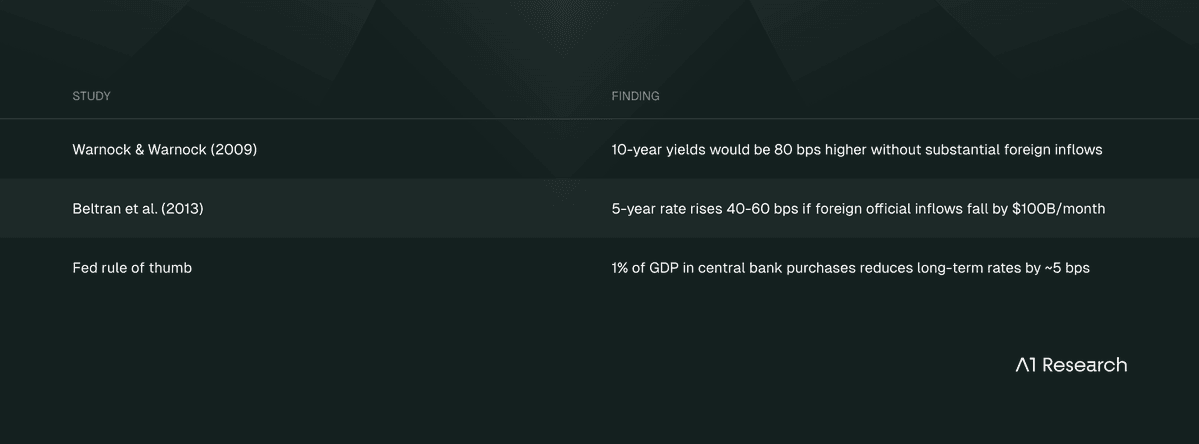
Step 4: GDP contraction from trade disruption reduces other tax receipts (rule of thumb: 1% GDP decline equals $300-400 billion revenue loss over 10 years).
Step 5: Net fiscal impact is neutral to negative, while debt continues growing.
Step 6: Increased debt issuance creates dollar pressure.
Step 7: Dollar pressure strengthens the case for monetary alternatives.
Each link is observable in the 2018-2019 precedent. The question is whether escalation continues long enough for the mechanism to play out.
Why This Could Drag On: The EU Dimension
The EU has prepared responses ready for deployment:
Bilateral Exposure:
Total trade: EUR 1.68 trillion ($1.5 trillion)
European holdings of US assets: Approximately $8 trillion (Deutsche Bank estimate: "almost twice as much as the rest of the world combined")
European Treasury holdings specifically: $3.64 trillion (November 2025, all-time high per CEIC/US Treasury data)
Retaliation Option 1: EUR 93 billion ($108 billion) traditional package targeting almonds, orange juice, soybeans, steel, aluminum. With the Greenland tariffs cancelled, the immediate trigger for this retaliation package is removed. However, the package remains prepared for potential future escalation.
Retaliation Option 2: Anti-Coercion Instrument ("Trade Bazooka"), never before used. Capabilities include restricting market access, excluding from public procurement, limiting foreign direct investment, and restricting EU-based financial infrastructure.
France is pushing for ACI activation. Germany prefers negotiation. The split means extended uncertainty is likely.
European Responses:
UK PM Keir Starmer: "Completely wrong" to apply tariffs on allies
Netherlands FM David van Weel: "It's blackmail"
European Parliament: Trade deal approval now "on hold"
Emergency EU Meeting: January 19, 2026
Post-De-Escalation Developments:
Despite Greenland de-escalation, the EU Parliament has separately suspended approval of the US-EU Turnberry Agreement and is considering activation of the Anti-Coercion Instrument. Underlying trade tensions persist independent of the Greenland resolution.
German MEP Bernd Lange (Trade Committee Chair): Called for ACI activation
The EU's prepared countermeasures make rapid full resolution less likely. Extended uncertainty favors gold in the short term but accelerates the fiscal deterioration chain over longer horizons.
The EU Treasury Question
Beyond trade retaliation, Europe holds a larger card: $3.64 trillion in US Treasuries, plus another $4+ trillion in US equities and corporate bonds. Deutsche Bank's George Saravelos: "The weaponization of capital rather than trade flows would by far be the most disruptive to markets."
Why Weaponization Is Unlikely
The structural barrier is ownership. The bulk of European Treasury holdings are private: pension funds, insurance companies, asset managers.
These are not government-controlled entities that can be directed to sell. For the EU to "weaponize" Treasury holdings, it would need to either direct private institutions to sell (legally complex, economically destructive to European savers) or have ECB and sovereign wealth funds sell their smaller portion.
Most strategists assess low probability that policymakers would go this far.
What If It Happened Anyway?
The China precedent provides a baseline. During the 2015-2016 yuan devaluation, China sold approximately $100-150 billion in reserves. Academic research quantifies the impact:
J.P. Morgan's analysis of China: "China has always been reluctant to sell en masse, because the market can't absorb such a large amount so quickly as it would cause their remaining dollar assets to depreciate."
The same logic applies to Europe. Selling $500 billion in Treasuries would crater the value of the remaining $3 trillion.
Net assessment: The EU Treasury weapon is real but constrained. Low probability of active weaponization; if it occurred, yields would spike 100-300 bps depending on scale, but the shock would be self-limiting because sellers would be destroying their own asset values.
The more likely scenario is passive reduction: not rolling over maturing securities, gradually shifting new investment elsewhere. This would put upward pressure on yields at the margin, contributing to the fiscal deterioration mechanism, but would not produce a discontinuous shock.
Part IV: The Stagflation Question
The fiscal mechanism creates pressure. But what does the Fed do about it? This is where the analysis gets uncomfortable, because tariffs are stagflationary by design: they raise prices while slowing growth. The Fed has been here before, and it went badly.
What Stagflation Means for Policy
Stagflation is the simultaneous occurrence of rising inflation and slowing growth, a combination that puts central banks in an impossible position.
Normally, inflation and unemployment move inversely: the Fed can fight one by tolerating the other. Stagflation breaks that tradeoff.
Tariffs are textbook stagflationary. They raise input costs (inflationary) while reducing trade and investment (contractionary). The question is whether current policy can navigate this without repeating historical mistakes.
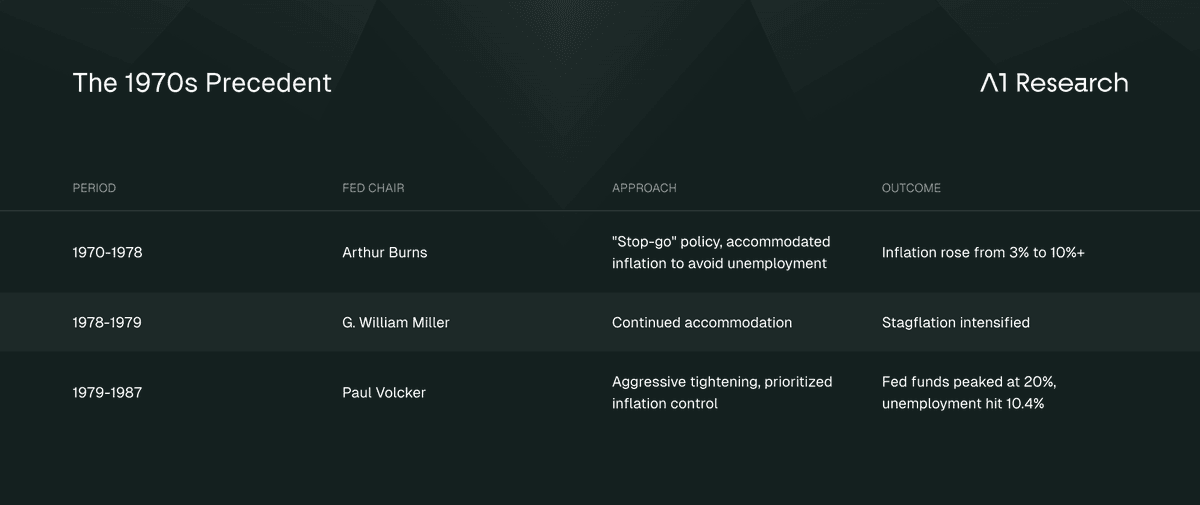
Burns generally pursued accommodative policies, opting to allow inflation to continue rather than risk raising unemployment further.
The result was entrenched inflation expectations that took a decade and a brutal recession to break.
Volcker's insight, stated in 1980: "My basic philosophy is that over time we have no choice but to deal with the inflationary situation because over time inflation and the unemployment rate go together."
He was right. But the medicine was severe: fed funds at 20%, unemployment at 10.4%, back-to-back recessions in 1980 and 1981-82.
Where the Fed Stands Now
Powell is unusually explicit about the bind.
From his December 2025 press conference (verbatim):
"It's very unusual to have persistent tension between the two parts of the mandate."
"We have upside risks to inflation, downside risks to employment. And this is a very difficult thing for a central bank, because one of those calls for rates to be lower, one calls for rates to be higher. We can't do both."
"There is no risk-free path for policy as we navigate this tension between our employment and inflation goals."
The December FOMC had three dissents in opposing directions: Stephen Miran wanted more easing, Jeffrey Schmid and Austan Goolsbee wanted no change.
The range between the most hawkish and most dovish 2026 projections spans 175 basis points. This is not a confident Fed.
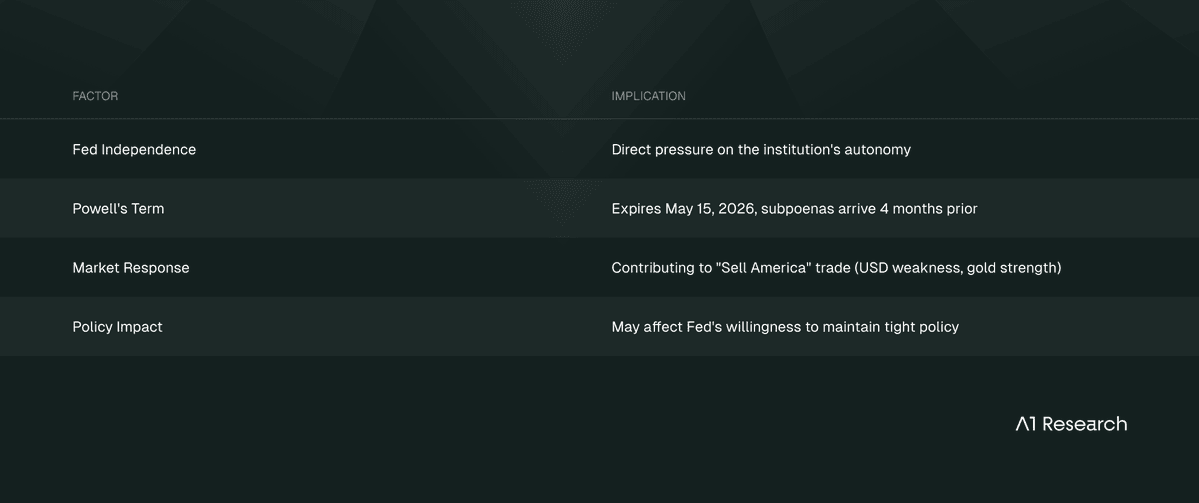
New Variable: DOJ Investigation of Jerome Powell
On January 9-11, 2026, the DOJ served the Federal Reserve with grand jury subpoenas targeting Fed Chair Powell.
Powell released a video statement calling the action "political intimidation."
This development adds a new dimension to the stagflation calculus:
The Burns/Volcker framework becomes more relevant: Burns accommodated inflation partly under political pressure.
The DOJ investigation raises the question of whether Powell, or his successor, will face similar pressure to prioritize growth over price stability.
This is not yet a central scenario, but it represents a tail risk that did not exist when this analysis began.
Tariff Passthrough: The Timing Problem
The Fed's current framework treats tariffs as a "one-time price level adjustment" rather than ongoing inflation. This determines whether they look through the inflation or respond to it.
The research on passthrough timing:
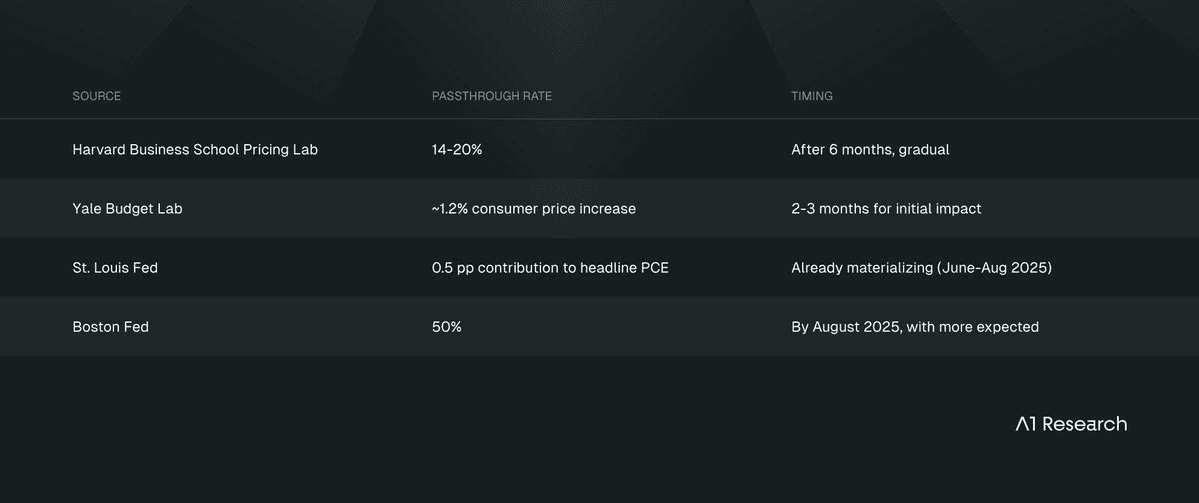
The Richmond Fed notes a "transit time of 6 weeks from China" that creates natural delay. Harvard's Econofact research found passthrough was "quick to begin, but gradual to unfold, and incomplete after six months."
The implication here: We are only partway through the price adjustment from existing tariffs. The Greenland tariffs, now cancelled, would have layered on top of incomplete passthrough from prior rounds.
Their cancellation removes this specific pressure, but existing tariffs (China 100%, baseline EU rates) continue their passthrough process.
Why This Time Might Be Different
Three factors distinguish current conditions from the 1970s:
1. Real rates are positive. The implied real short-term rate (fed funds minus inflation) is approximately 0.5-1.0%. The 10-year TIPS real yield sits at 1.95-2.0%. In the 1970s, real rates were deeply negative, meaning the Fed was actively fueling inflation. Today's Fed has room to ease without going negative in real terms.
2. Fed credibility is higher. Volcker's painful success bought the institution credibility. Inflation expectations remain anchored near 2% in long-term surveys, unlike the 1970s when expectations spiraled. The Fed can invoke that credibility to look through temporary shocks.
3. Tariffs are a discrete shock, not monetary expansion. 1970s inflation was driven partly by money supply growth. Tariffs raise the price level but don't create ongoing monetary pressure. If tariffs stabilize, so should prices.
Why This Time Might Not Be Different
Three factors cut the other way:
1. Tariffs are not stabilizing. While Greenland-specific tariffs have been cancelled, the broader tariff structure remains in place, and repeated escalation-de-escalation cycles create their own form of uncertainty. If EU retaliates on other fronts and the US responds, you get repeated price level shocks that look like ongoing inflation even if each is technically "one-time."
2. The Fed's core PCE projection is already 3.0% for 2025. That's 50% above target. Add 0.4-0.5 percentage points from tariff passthrough per CBO projections, and you're approaching 3.5%, the threshold that historically triggers tightening.
3. Powell's term expires May 15, 2026. The January DOJ investigation adds direct institutional pressure to existing appointment concerns. Political pressure on Fed appointments could shift the institution's reaction function. A Chair more sympathetic to growth, or to the administration, might repeat Burns' mistake.
The Two Paths
Path A: Volcker Redux
The Fed prioritizes inflation credibility, keeps rates elevated despite slowing growth, accepts higher unemployment as the cost of price stability.
This is painful for risk assets in the short term but clears the decks for sustainable recovery. Bitcoin likely falls further initially, then recovers as monetary stability returns.
Path B: Burns Redux
The Fed accommodates inflation to avoid recession, real rates go negative, inflation expectations de-anchor.
This is supportive of nominal asset prices in the short term but creates longer-term instability. Bitcoin likely rallies as dollar purchasing power erodes, but in a chaotic environment.
Ultimately, the honest answer is that we don't know which path the Fed will take.
Powell's language suggests awareness of the Burns trap, but awareness is not the same as willingness to impose pain.
Part V: Reading the Market Structure
Understanding why initial moves overshoot requires looking at derivatives positioning.
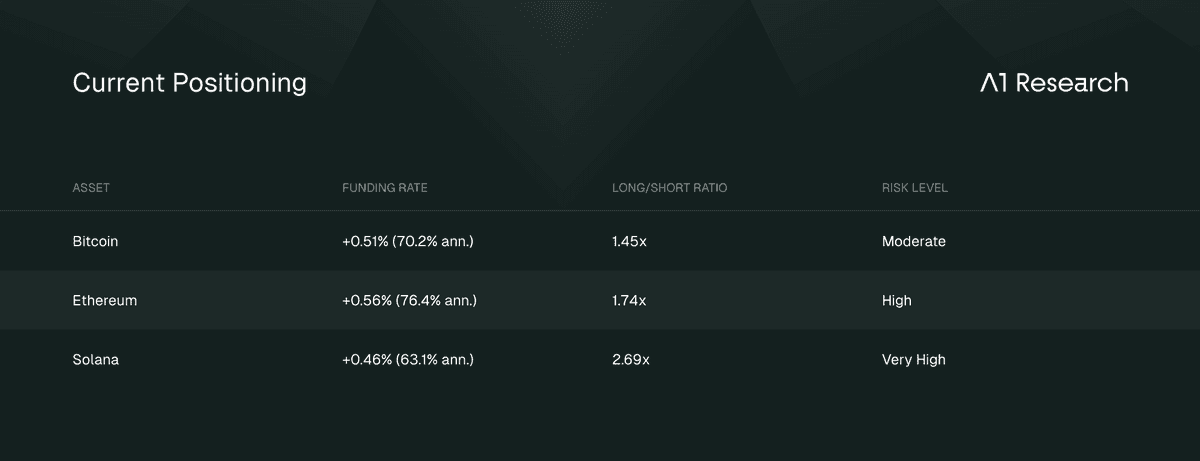
Source: CoinGlass.
Elevated long/short ratios, particularly Solana's 2.69x, explain liquidation cascades.
When prices decline, leveraged longs are forced to sell, amplifying moves.
The $80K Threshold
On November 21, 2025, Bitcoin briefly touched $80,000. Within hours, $2 billion was liquidated. This establishes $80K as a critical threshold where breach risks a cascade.
Current support structure:
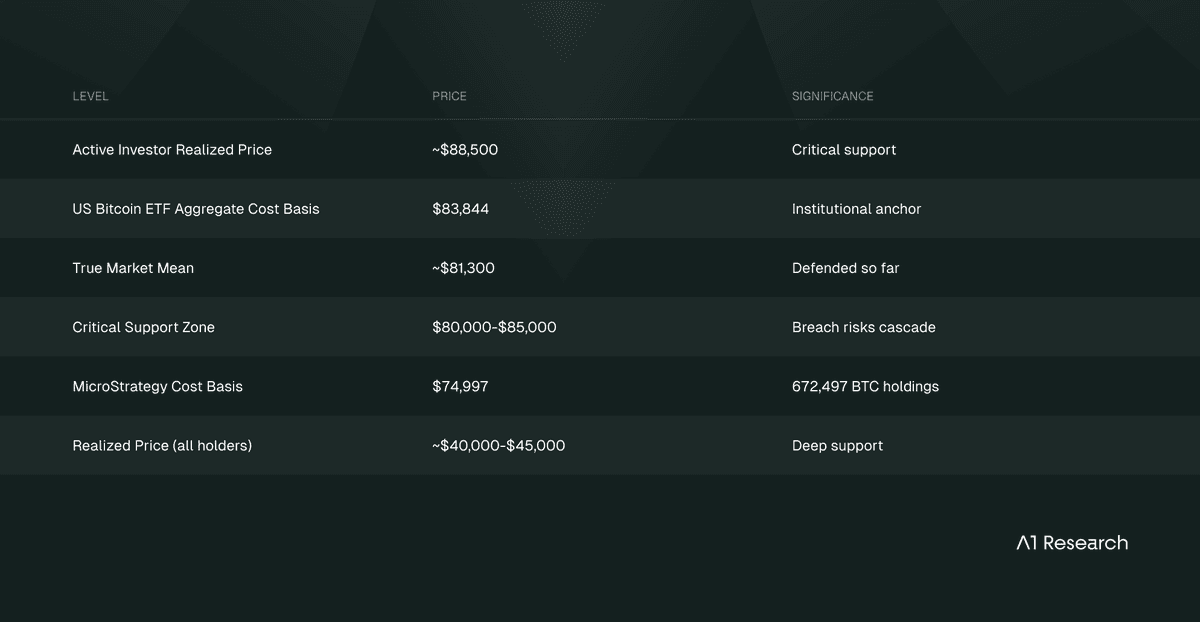
Source: Glassnode Week 1-3 2026 reports.
The Good News
Open interest is down 40% from the October 2025 peak. The largest options expiry on record cleared 45% of positioning. Realized profit (7-day SMA) dropped to $183 million daily from over $1 billion in Q4 2025, indicating sell-side pressure is exhausted.
Long-term holders resumed accumulation on December 26 (first since September).
ETF flows showed volatility: early January saw $1.2 billion inflows, but the Greenland event triggered approximately $480 million in outflows. The pattern suggests institutional engagement remains reactive to policy uncertainty.
The market structure is healthier than it was before the October crash. This matters for how much further downside is likely.
However, Bitcoin's failure to rally alongside equities following de-escalation suggests continued fragility despite improved positioning metrics.
Monetary Policy Context
Federal Reserve:
Current rate: 3.50%-3.75% (three 25bp cuts in H2 2025)
January FOMC: 84% probability hold, 16% probability cut
Core PCE: 2.7%-2.8% (above 2% target)
Powell term expires: May 15, 2026
DOJ Investigation: Grand jury subpoenas served Jan 9-11; Powell's "political intimidation" statement
European Central Bank:
Current deposit rate: 2.00% (fourth consecutive hold)
2026 baseline: Hold throughout
Staff forecasts: 1.9% inflation, 1.2% GDP growth
Current Market Indicators (Post-De-Escalation):
VIX: 15.06 (dropped below critical 20 threshold, indicating reduced near-term risk)
10-Year Treasury: 4.29% (+5 bps from pre-event, stabilized below Bessent's 5% threshold)
Part VI: Staying Honest
What Would Prove This Wrong
1. Rapid Resolution: Tariff withdrawal within 30 days without lasting inflation impact.
UPDATE (January 22, 2026): The January 21 Davos framework represents partial fulfillment of this criterion. Tariffs were cancelled within 5 days of announcement. However, two factors prevent this from invalidating the thesis:
a) The "without lasting inflation impact" portion remains untested. Existing tariffs continue their passthrough process.
b) Bitcoin's asymmetric response (failing to recover despite de-escalation) actually strengthens the thesis rather than weakening it.
Revised criterion: Rapid resolution that produces symmetric Bitcoin recovery alongside equities would challenge the thesis. This did not occur.
2. Credible Fiscal Consolidation: Congressional action to reduce the deficit trajectory.
3. Sustained Disinflation: Core PCE falling to 2.0% despite tariff implementation.
4. Structural Bitcoin Breakdown: Failure to hold $65K within 60 days of peak uncertainty.
5. Alternative Safe Haven Emergence: New asset class capturing monetary premium flows.
Conclusion
The Greenland tariff announcement, and its subsequent de-escalation, triggered exactly what history predicted, then provided a second confirming data point. Bitcoin fell during escalation, failed to recover during de-escalation, while gold rallied and held gains.
The 10.55 percentage point BTC/Gold divergence persisted through resolution, consistent with seven prior policy uncertainty events.
The core insight here is simple: Bitcoin is NOT digital gold.
It is a high-beta macro asset that amplifies both downside and upside. The "digital gold" narrative has failed in 7 of 8 tests.
But that does not mean the setup is unfavorable.
Understanding Bitcoin's actual behavior, rather than its mythologized behavior, allows for rational positioning:
1. The fiscal mechanism is real. Tariffs generate revenue that gets offset by bailouts while contracting GDP. The 2018-2019 precedent shows 92% offset. The January 21 de-escalation removes the Greenland-specific layer but does not alter the underlying mechanism from existing tariffs.
2. The stagflation risk is real but different from the 1970s. Real rates are positive, Fed credibility is higher, and tariffs are discrete shocks rather than monetary expansion. But Powell faces an impossible choice, and repeated tariff escalation could look like ongoing inflation even if each round is "one-time." The January DOJ investigation of Powell adds a new variable: potential compromise of Fed independence, echoing the political pressures that contributed to Burns' accommodative stance in the 1970s.
3. The EU dimension persists despite Greenland de-escalation. The EU Parliament has separately suspended trade deal approval, and activation of the Anti-Coercion Instrument remains under consideration. Financial weaponization of Treasury holdings is constrained but not impossible.
4. The market structure has improved. Open interest down 40%, sell-side pressure exhausted, institutions re-engaging. However, $480 million in ETF outflows during the Greenland event and Bitcoin's failure to recover alongside equities following de-escalation suggest fragility remains.
5. The support levels are identifiable. $80-85K is the zone that matters. Below that, cascade risk increases. These levels remain intact and untested following de-escalation, providing a cleaner setup for patient positioning.
6. The expected value math favors patience under reasonable assumptions. The January 21 framework increases Scenario A (negotiated resolution) probability while leaving the medium-term thesis intact. Near-term drawdown risk is reduced; the case for monetary alternatives over longer horizons is unchanged.
The framework announcement does not invalidate patience as a positioning strategy. It reduces the probability of near-term drawdown to $80K support while leaving the medium-term case for monetary alternatives intact.
This is not a prediction that Bitcoin will rise. It is an observation that the conditions creating short-term stress are the same conditions that, if they persist, strengthen the longer-term case for monetary alternatives.
The Greenland event's resolution removes one near-term stressor while the de-escalation response provides the clearest evidence yet for Bitcoin's true nature as a risk asset.
The data must lead the thesis. Patient capital with appropriate position sizing may find an asymmetric opportunity.
But only if you understand what you actually own.
Recommended Articles
Dive into 'Narratives' that will be important in the next year

" height="53.254000000000005px" id="poHfazHFu" transform="translate(192 19.5)" width="54.447px"/><path d="M 17.077 0 C 20.225 0 23.038 0.665 25.515 1.994 C 28.06 3.324 30.036 5.153 31.442 7.48 C 32.916 9.74 33.652 12.233 33.652 14.96 L 25.114 14.96 C 25.114 12.832 24.344 11.036 22.804 9.573 C 21.263 8.111 19.354 7.38 17.077 7.38 C 14.867 7.38 12.992 8.045 11.452 9.374 C 9.979 10.637 9.242 12.234 9.242 14.161 C 9.242 16.289 10.112 18.051 11.853 19.446 C 13.662 20.843 16.207 21.973 19.488 22.837 C 24.176 24.034 27.826 25.863 30.437 28.322 C 33.049 30.782 34.355 34.007 34.355 37.996 C 34.355 41.054 33.585 43.746 32.045 46.073 C 30.571 48.333 28.53 50.096 25.918 51.36 C 23.306 52.623 20.392 53.254 17.178 53.254 C 13.963 53.254 11.05 52.555 8.438 51.159 C 5.827 49.763 3.75 47.902 2.21 45.575 C 0.736 43.182 0 40.522 0 37.597 L 8.539 37.597 C 8.539 39.924 9.376 41.885 11.05 43.481 C 12.724 45.076 14.8 45.874 17.278 45.874 C 19.622 45.874 21.598 45.209 23.205 43.88 C 24.879 42.484 25.717 40.755 25.717 38.694 C 25.717 36.5 24.845 34.704 23.104 33.309 C 21.363 31.846 18.818 30.683 15.47 29.819 C 10.916 28.689 7.3 26.926 4.621 24.532 C 2.009 22.139 0.703 18.815 0.703 14.56 C 0.703 11.635 1.406 9.075 2.812 6.881 C 4.286 4.687 6.261 2.991 8.739 1.795 C 11.284 0.598 14.063 0 17.077 0 Z" fill="rgb(255, 255, 255)" height="53.25400000000002px" id="dwV_m7WwK" transform="translate(254.5 19.5)" width="34.35500000000002px"/><path d="M 27.223 0 C 32.313 0 36.934 1.163 41.086 3.49 C 45.238 5.817 48.486 9.009 50.83 13.064 C 53.241 17.12 54.447 21.641 54.447 26.627 C 54.447 27.957 54.347 29.12 54.146 30.117 L 8.81 30.117 C 9.154 32.32 9.878 34.446 10.95 36.401 C 12.557 39.259 14.767 41.52 17.579 43.181 C 20.459 44.844 23.674 45.675 27.223 45.675 C 31.107 45.675 34.557 44.778 37.571 42.982 C 40.651 41.187 42.895 38.794 44.301 35.802 L 53.342 35.802 C 51.467 41.054 48.185 45.276 43.497 48.467 C 38.809 51.658 33.384 53.254 27.223 53.254 C 22.133 53.254 17.513 52.091 13.361 49.764 C 9.209 47.437 5.927 44.245 3.516 40.189 C 1.172 36.134 0 31.613 0 26.627 C 0 21.641 1.172 17.12 3.516 13.064 C 5.927 9.009 9.209 5.817 13.361 3.49 C 17.513 1.164 22.133 0 27.223 0 Z M 27.223 7.58 C 23.674 7.58 20.459 8.41 17.579 10.072 C 14.767 11.734 12.557 14.028 10.95 16.953 C 9.958 18.722 9.265 20.643 8.898 22.638 L 45.545 22.638 C 45.137 20.485 44.341 18.424 43.196 16.555 C 41.588 13.762 39.378 11.568 36.566 9.973 C 33.753 8.377 30.638 7.579 27.223 7.579 Z M 103.691 44.578 L 110.522 44.578 L 110.522 52.058 L 96.257 52.058 L 96.257 45.427 C 94.611 47.805 92.401 49.683 89.627 51.06 C 86.748 52.522 83.533 53.254 79.984 53.254 C 76.501 53.254 73.353 52.522 70.54 51.06 C 67.795 49.53 65.585 47.503 63.91 44.977 C 62.303 42.45 61.499 39.592 61.499 36.401 C 61.499 33.209 62.303 30.35 63.91 27.823 C 65.518 25.231 67.728 23.203 70.54 21.74 C 73.353 20.278 76.501 19.546 79.984 19.546 L 95.453 19.546 L 95.453 9.076 L 64.915 9.076 L 64.915 1.196 L 103.691 1.196 Z M 80.888 26.926 C 78.879 26.926 77.037 27.359 75.363 28.223 C 73.688 29.021 72.382 30.151 71.445 31.613 C 70.507 33.009 70.038 34.605 70.038 36.401 C 70.038 38.129 70.507 39.724 71.445 41.187 C 72.382 42.649 73.688 43.814 75.363 44.677 C 77.037 45.476 78.879 45.874 80.888 45.874 C 83.768 45.874 86.279 45.443 88.422 44.578 C 90.632 43.648 92.34 42.417 93.545 40.888 C 94.818 39.292 95.453 37.463 95.453 35.402 L 95.453 26.926 Z" fill="rgb(255, 255, 255)" height="53.254000000000005px" id="J9sNA1zvT" transform="translate(296.5 19.5)" width="110.52200054931643px"/><path d="M 472.484 17.603 C 476.837 17.603 480.856 18.467 484.539 20.196 C 488.222 21.858 491.302 24.218 493.78 27.276 C 496.325 30.334 498.034 33.792 498.904 37.648 L 490.164 37.648 C 488.825 33.991 486.581 31.066 483.434 28.872 C 480.286 26.678 476.636 25.581 472.484 25.581 C 469.002 25.581 465.82 26.411 462.94 28.074 C 460.128 29.669 457.884 31.897 456.21 34.755 C 454.603 37.615 453.8 40.773 453.8 44.23 C 453.8 47.687 454.603 50.845 456.21 53.704 C 457.884 56.562 460.128 58.824 462.94 60.486 C 465.82 62.082 469.002 62.879 472.484 62.879 C 476.636 62.879 480.286 61.781 483.434 59.587 C 486.581 57.393 488.825 54.469 490.164 50.812 L 498.904 50.812 C 498.034 54.668 496.325 58.125 493.78 61.183 C 491.302 64.241 488.222 66.635 484.539 68.363 C 480.856 70.027 476.837 70.857 472.484 70.857 C 467.395 70.857 462.773 69.694 458.621 67.367 C 454.469 65.04 451.187 61.848 448.776 57.792 C 446.433 53.737 445.261 49.216 445.261 44.23 C 445.261 39.244 446.433 34.723 448.776 30.667 C 451.187 26.612 454.469 23.42 458.621 21.093 C 462.773 18.766 467.395 17.603 472.484 17.603 Z M 68.395 70.021 L 58.566 70.021 L 34.197 10.609 L 9.83 70.021 L 0 70.021 L 28.873 0 L 39.522 0 Z M 96.18 70.021 L 87.443 70.021 L 87.443 10.047 L 71.775 10.047 L 71.775 0 L 96.181 0 L 96.181 70.021 Z" fill="rgb(255, 255, 255)" height="70.85700064086915px" id="XyVzovWZk" transform="translate(0 2)" width="498.90398632812503px"/><path d="M 22.401 0 C 26.419 0 30.036 0.93 33.251 2.792 C 36.532 4.587 39.11 7.081 40.985 10.272 C 42.86 13.396 43.799 16.92 43.799 20.843 C 43.799 24.699 42.86 28.189 40.985 31.313 C 39.11 34.372 36.566 36.799 33.351 38.593 C 31.265 39.754 28.996 40.549 26.642 40.943 L 45.205 68.812 L 34.557 68.812 L 16.616 41.286 L 8.84 41.286 L 8.84 68.812 L 0 68.812 L 0 0 Z M 8.84 33.608 L 22.2 33.608 C 24.544 33.608 26.688 33.076 28.63 32.012 C 30.572 30.882 32.079 29.352 33.15 27.425 C 34.222 25.497 34.758 23.336 34.758 20.943 C 34.758 18.549 34.222 16.388 33.15 14.46 C 32.079 12.532 30.572 11.003 28.63 9.873 C 26.688 8.743 24.544 8.177 22.2 8.177 L 8.84 8.177 Z" fill="rgb(255, 255, 255)" height="68.812px" id="tX8m5fMcV" transform="translate(141 3)" width="45.20500000000001px"/><path d="M 25.215 28.622 C 21.732 28.622 18.685 29.352 16.073 30.815 C 13.528 32.278 11.586 34.34 10.247 36.999 C 8.908 39.592 8.237 42.65 8.237 46.174 L 8.237 71.804 L 0 71.804 L 0 20.942 L 8.237 20.942 L 8.237 30.4 C 10.035 27.253 12.277 24.798 14.969 23.037 C 17.982 21.109 21.397 20.145 25.215 20.145 Z M 102.415 29.563 C 104.366 26.491 106.844 24.116 109.848 22.439 C 113.13 20.643 116.88 19.746 121.099 19.746 C 125.185 19.746 128.801 20.61 131.948 22.339 C 135.163 24.001 137.64 26.428 139.382 29.619 C 141.123 32.744 141.994 36.367 141.994 40.489 L 141.994 71.804 L 133.757 71.804 L 133.757 42.982 C 133.757 38.395 132.351 34.705 129.538 31.912 C 126.792 29.12 123.108 27.724 118.487 27.724 C 115.273 27.724 112.427 28.356 109.949 29.619 C 107.538 30.882 105.663 32.71 104.323 35.103 C 103.051 37.431 102.415 40.123 102.415 43.182 L 102.415 71.804 L 94.178 71.804 L 94.178 0 L 102.415 0 Z" fill="rgb(255, 255, 255)" height="71.80400045776368px" id="YoO0zKl7f" transform="translate(416 0)" width="141.99400140380868px"/></g><g d="M 8.96 4.214 C 9.786 4.214 10.48 4.51 11.042 5.107 C 11.637 5.668 11.936 6.362 11.936 7.189 C 11.936 8.014 11.637 8.725 11.042 9.32 C 10.749 9.613 10.42 9.826 10.055 9.967 L 12.183 13.732 L 10.4 13.732 L 8.453 10.162 L 7.471 10.162 L 7.471 13.734 L 5.884 13.734 L 5.884 4.212 L 8.959 4.212 Z M 7.473 8.725 L 8.86 8.725 C 9.29 8.725 9.638 8.592 9.902 8.328 C 10.201 8.026 10.362 7.614 10.347 7.189 C 10.356 6.779 10.196 6.384 9.904 6.097 C 9.64 5.8 9.258 5.636 8.861 5.651 L 7.473 5.651 Z M 9.026 0 C 10.712 0 12.234 0.396 13.587 1.189 C 14.952 1.926 16.072 3.046 16.81 4.412 C 17.603 5.769 18 7.29 18 8.975 C 18 10.693 17.603 12.23 16.81 13.584 C 16.053 14.937 14.938 16.053 13.587 16.809 C 12.232 17.601 10.712 18 9.026 18 C 7.308 18 5.753 17.618 4.366 16.858 C 3.03 16.084 1.919 14.973 1.143 13.636 C 0.382 12.248 0.002 10.693 0 8.975 C 0 7.29 0.382 5.769 1.143 4.412 C 1.9 3.061 3.015 1.945 4.366 1.189 C 5.753 0.398 7.308 0 9.026 0 Z M 9.026 1.638 C 7.72 1.624 6.435 1.967 5.307 2.628 C 4.216 3.257 3.309 4.164 2.68 5.256 C 2.051 6.379 1.738 7.635 1.738 9.024 C 1.738 10.38 2.051 11.618 2.68 12.742 C 3.328 13.82 4.23 14.722 5.307 15.37 C 6.432 15.999 7.671 16.314 9.026 16.314 C 10.381 16.314 11.605 15.999 12.696 15.37 C 13.766 14.73 14.653 13.825 15.273 12.742 C 15.934 11.618 16.265 10.363 16.265 8.975 C 16.278 7.667 15.935 6.381 15.273 5.255 C 14.662 4.148 13.75 3.237 12.644 2.627 C 11.553 1.967 10.3 1.625 9.026 1.639 Z" fill="transparent" height="18px" id="fDqcVjis4" transform="translate(571 0)" width="18px"><path d="M 3.076 0.002 C 3.902 0.002 4.596 0.298 5.158 0.895 C 5.753 1.456 6.052 2.15 6.052 2.977 C 6.052 3.803 5.753 4.513 5.158 5.108 C 4.865 5.401 4.536 5.614 4.171 5.755 L 6.299 9.521 L 4.516 9.521 L 2.569 5.951 L 1.587 5.951 L 1.587 9.522 L 0 9.522 L 0 0 L 3.075 0 Z M 1.589 4.513 L 2.976 4.513 C 3.406 4.513 3.754 4.38 4.018 4.116 C 4.317 3.814 4.478 3.402 4.463 2.977 C 4.472 2.567 4.312 2.172 4.02 1.885 C 3.756 1.588 3.374 1.424 2.977 1.439 L 1.589 1.439 Z" fill="rgb(255, 255, 255)" height="9.522276301010859px" id="YcHNItJFD" transform="translate(5.884 4.212)" width="6.299243485570059px"/><path d="M 9.026 0 C 10.712 0 12.234 0.396 13.587 1.189 C 14.952 1.926 16.072 3.046 16.81 4.412 C 17.603 5.769 18 7.29 18 8.975 C 18 10.693 17.603 12.23 16.81 13.584 C 16.053 14.937 14.938 16.053 13.587 16.809 C 12.232 17.601 10.712 18 9.026 18 C 7.308 18 5.753 17.618 4.366 16.858 C 3.03 16.084 1.919 14.973 1.143 13.636 C 0.382 12.248 0.002 10.693 0 8.975 C 0 7.29 0.382 5.769 1.143 4.412 C 1.9 3.061 3.015 1.945 4.366 1.189 C 5.753 0.398 7.308 0 9.026 0 Z M 9.026 1.638 C 7.72 1.624 6.435 1.967 5.307 2.628 C 4.216 3.257 3.309 4.164 2.68 5.256 C 2.051 6.379 1.738 7.635 1.738 9.024 C 1.738 10.38 2.051 11.618 2.68 12.742 C 3.328 13.82 4.23 14.722 5.307 15.37 C 6.432 15.999 7.671 16.314 9.026 16.314 C 10.381 16.314 11.605 15.999 12.696 15.37 C 13.766 14.73 14.653 13.825 15.273 12.742 C 15.934 11.618 16.265 10.363 16.265 8.975 C 16.278 7.667 15.935 6.381 15.273 5.255 C 14.662 4.148 13.75 3.237 12.644 2.627 C 11.553 1.967 10.3 1.625 9.026 1.639 Z" fill="rgb(255, 255, 255)" height="18px" id="VlQ3a59vB" width="18px"/></g></svg>)